

Full-stack correlation
to isolate the root cause and accelerate MTTR during incidents.

Real-time operational visibility, portable architecture, and a common view for SRE, DevOps, and engineering leadership.
EyeNode by DDOSCOM brings metrics, logs, traces, and continuous profiles into a shared operational context.
Observability for infrastructure decisions
EyeNode by DDOSCOM brings metrics, logs, traces, and continuous profiles into a shared operational context. Your team detects degradation with evidence, investigates the root cause with less manual investigation, and decides where to act before expanding capacity.
Real-time operational visibility, portable architecture, and a common view for SRE, DevOps, and engineering leadership.
Real-time operational visibility, portable architecture, and a common view for SRE, DevOps, and engineering leadership.
Full-stack correlation to isolate the root cause and accelerate MTTR during incidents.
to isolate the root cause and accelerate MTTR during incidents.
to reduce the work of rebuilding context across tools and shorten operational decisions.
to reduce the risk and operating cost of a platform migration.
to prioritize constrained resources and contain cloud overprovisioning.
so leadership, SRE, and DevOps decide from the same evidence.
Your team runs distributed infrastructure. Metrics live in one dashboard, logs in another tool, and traces in a third. Every incident requires rebuilding context across providers, formats, and panels. Time is spent integrating signals instead of solving the problem.
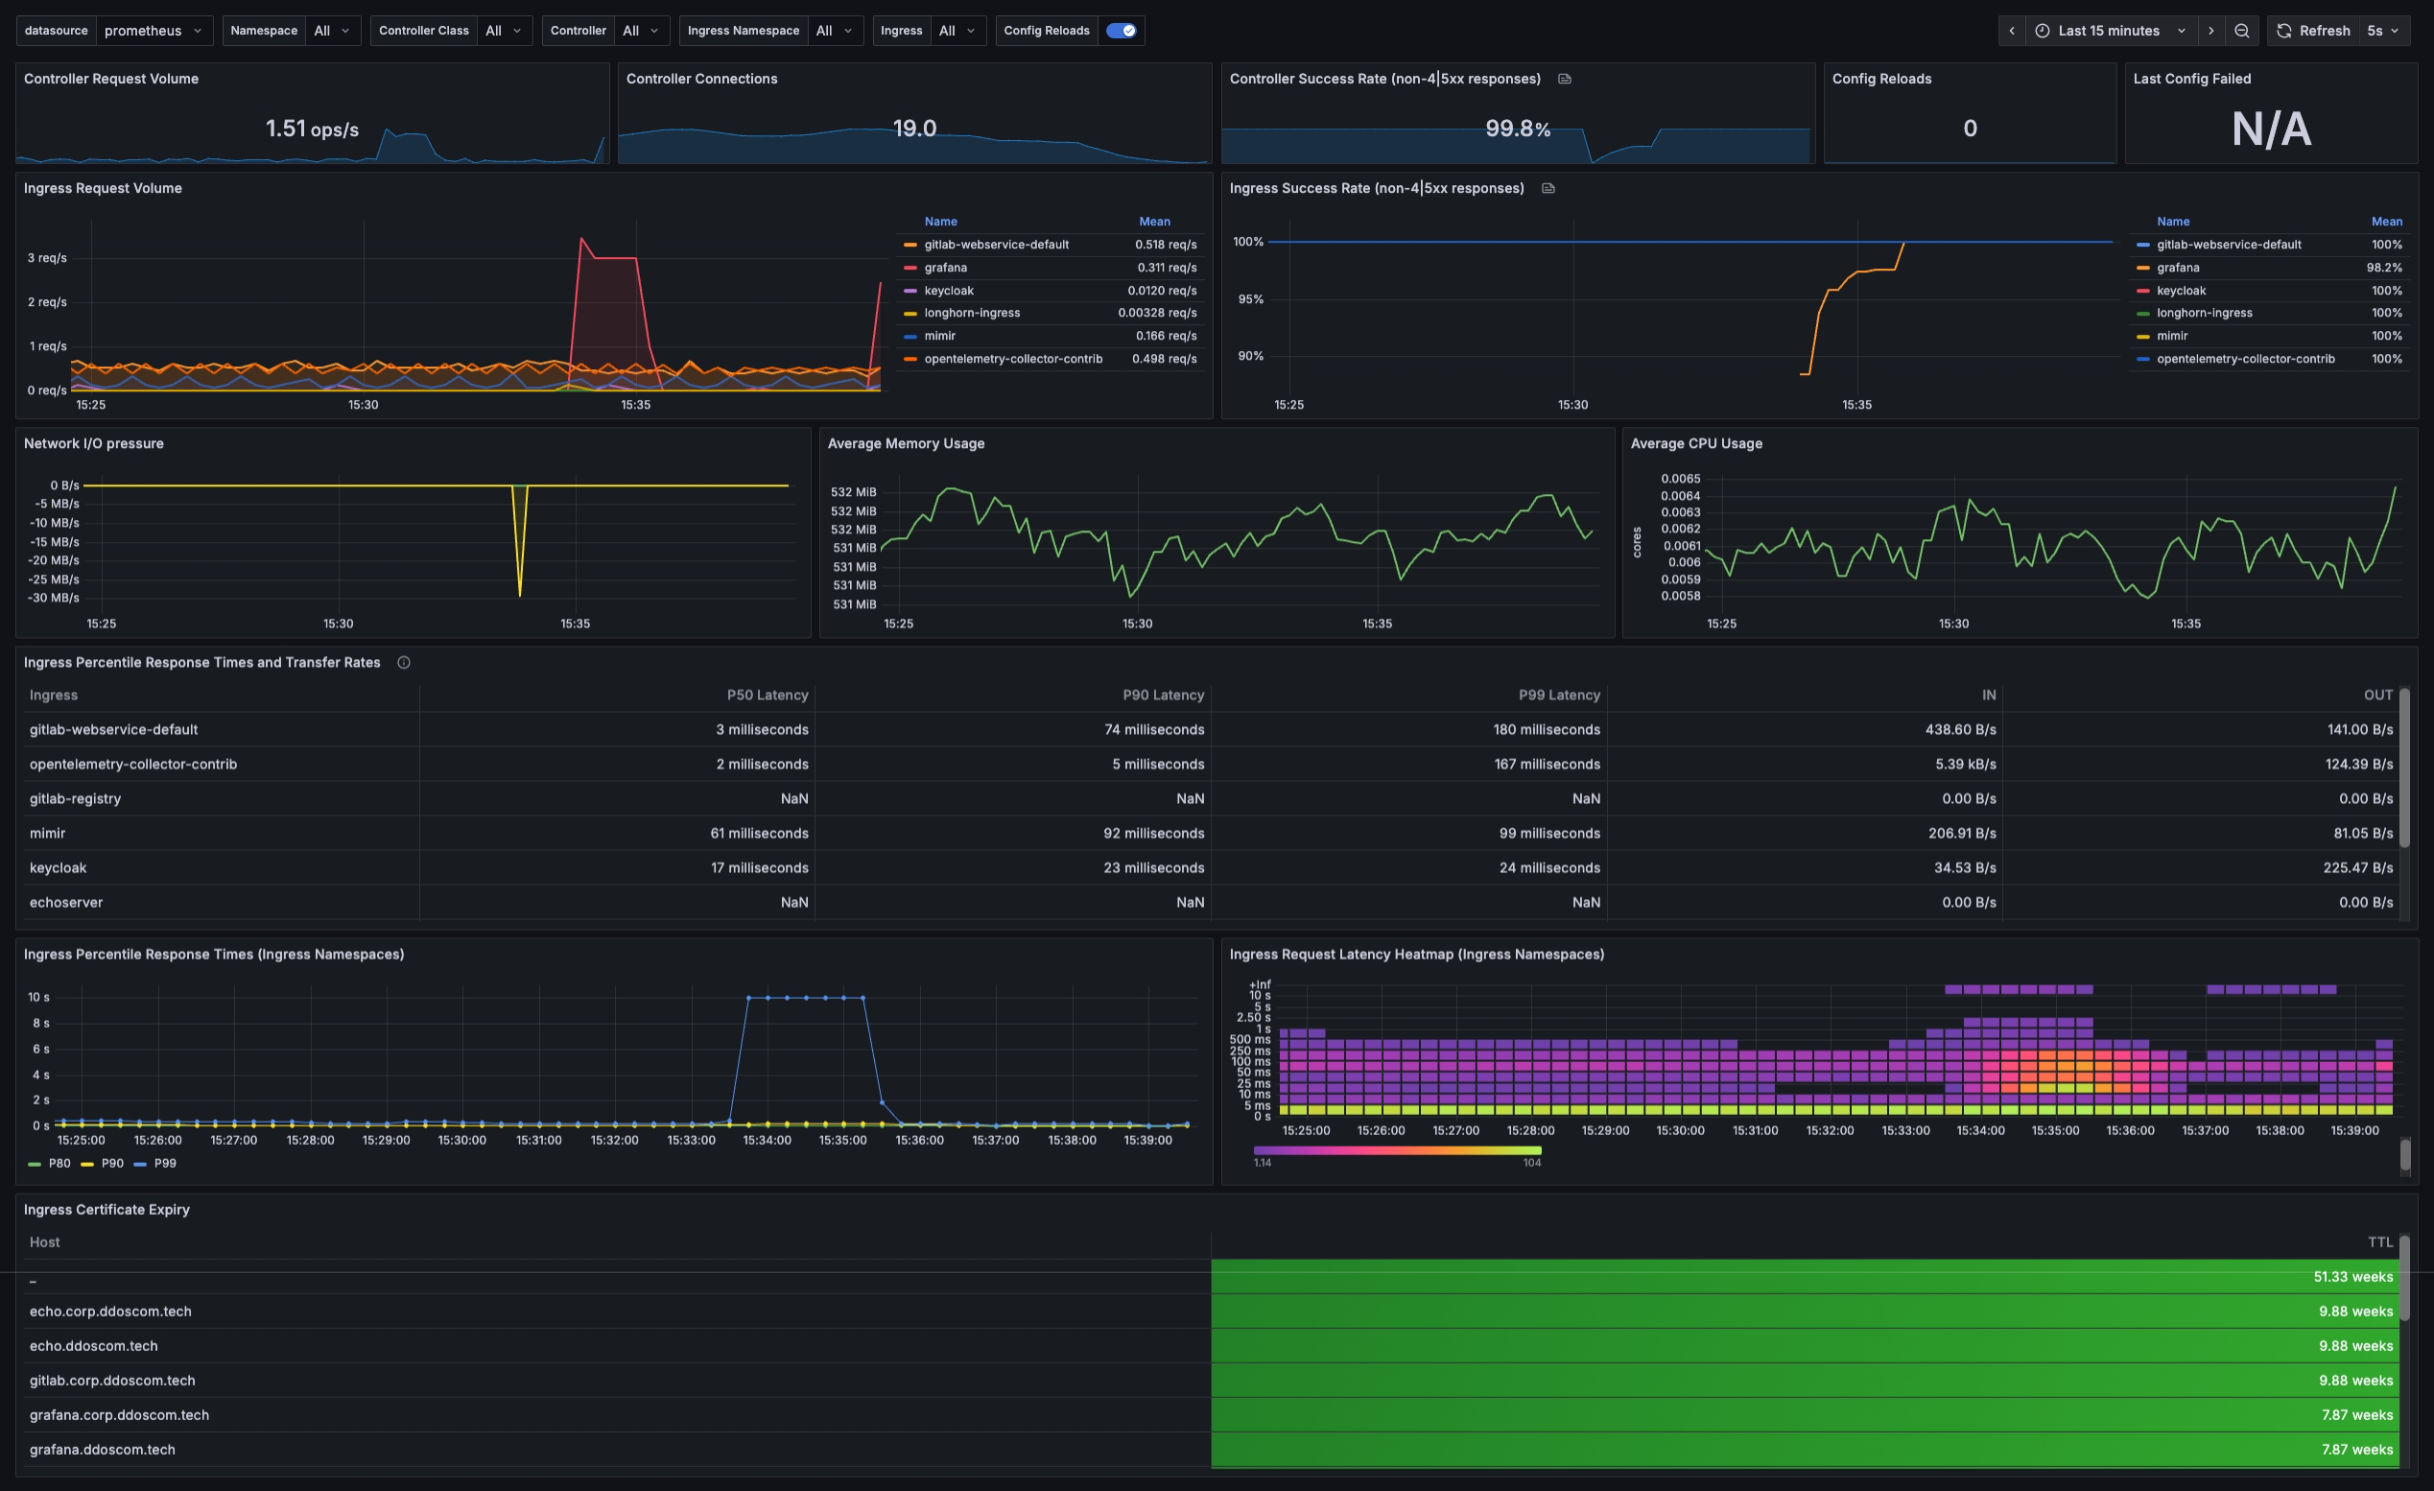
EyeNode presents every infrastructure signal in a shared operational view. Metrics, logs, and traces coexist in the same panel, with the same context, at the same moment. Your team reads infrastructure state rather than three different tool interfaces.
Your observability data is not trapped in a proprietary format. EyeNode operates on open standards. You can migrate, scale, or change cloud provider without rewriting your observability stack. The technical decision remains yours.
Visualize all your metrics with minimal latency and guaranteed accuracy. EyeNode ingests signals directly from production environments and presents them on a common operational timeline. No manual consolidation. No lost context between events.
Alerts anticipate anomalous patterns before they affect users. EyeNode correlates signals and detects deviations from expected infrastructure behavior. Less noise. More focus on signals requiring an immediate response.
Connect your stack in minutes without additional agents. EyeNode reads signals directly from your clusters and cloud services. Integration respects your existing configuration and does not require rewriting deployment pipelines.
A centralized dashboard where infrastructure, SRE, and DevOps share the same operational context. Every team member reads the same signals at the same moment from the same source. Operational decisions are made on a common information base.
Your telemetry data belongs to you. EyeNode does not impose proprietary formats that limit your ability to migrate, scale, or audit signals. Data portability is guaranteed by design.
EyeNode by DDOSCOM comes from years of operating critical infrastructure. It is not a visualization layer on an existing product: it is a platform designed by infrastructure teams for infrastructure teams. Every architectural decision responds to an operational problem the DDOSCOM team has faced in production.
EyeNode works with OpenTelemetry, Prometheus, and open telemetry formats. Your team does not need to learn a proprietary DSL or adapt instrumentation to a closed ecosystem. The signals you already generate are the signals EyeNode reads.
We do not publish SLAs we cannot support. We do not invent savings metrics. We do not promise complete coverage for stacks we have not integrated. Every capability documented on this page is supported by actual product behavior on the current route.
Teams validating the platform in development or staging
Unified panel, technical documentation, and community access; [ ] limits remain pending validation.
Teams that need to expand their production operational view
Telemetry, alerts, and retention remain subject to commercial validation.
Organizations with specific deployment, security, compliance, or data sovereignty requirements
Tailored scope and conditions, subject to validation.
Access the EyeNode by DDOSCOM Dashboard to review telemetry in a shared context. If you need to evaluate commercial scope for your organization, compare the available plans.
Two clear paths: operate with EyeNode or review the right plan for your team.